With the help of data collection, storage and processing technologies (Big Data), manufacturing enterprises can reduce the cost of products, optimize the production process, and reduce the impact of the human factor.
The information extracted from data that was practically not used before is now becoming a competitive advantage for manufacturing. For example, a sensor above the conveyor along which the product travels is now becoming a source of such information: the data coming from it makes it possible to track the interval between defective products and take action in time. This allows you to reduce the percentage of defects in production by 2-3 times.
How is data collected and what data is analyzed?
The QuatroPBC automated quality control system uses machine learning algorithms to collect and process information about each product that passes on a pallet along the conveyor. That’s how the data on the manufactured products is transmitted directly to the software on the employee's computer.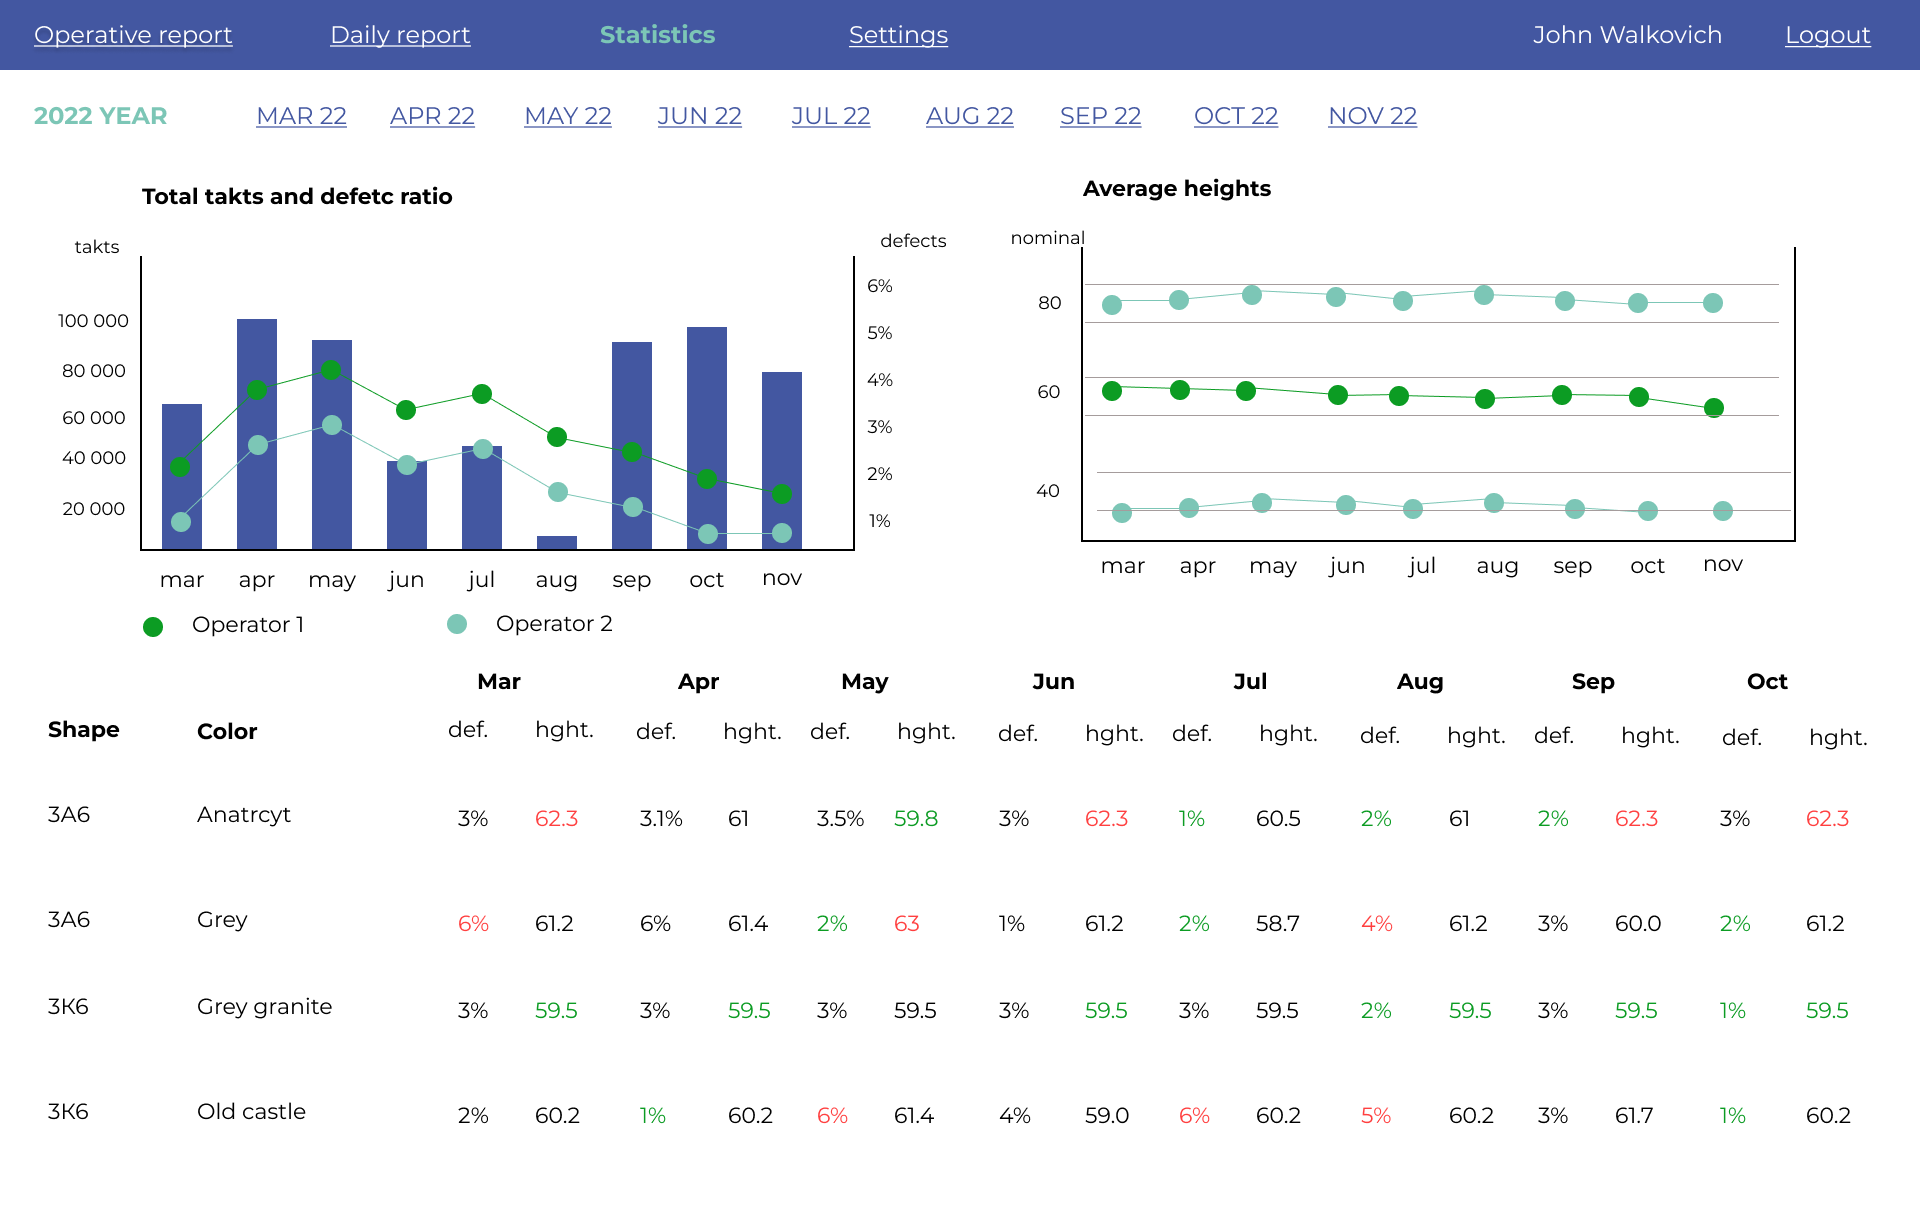
What data QuatroPBC analyzes:
1. Heights of each stone on each pallet;
2. Defects on every stone on every pallet;
3. The average density of the stones on the pallet (in case there are scales);
4. Statistics on the last pallets (trend):
- distribution of heights,
- density,
- percentage of defects;
5. Molding report for each shift for each batch:
- type of product (determined automatically),
- color (determined automatically),
- number of cycles,
- percentage of rejects (including height and defects of the front layer);
6. Production log in which you can see when and what was produced and with what parameters;
7. Photo of each stone on each pallet (current storage horizon - 90 days).
How is data analysis used in production of paving slabs?
During the production process, quality assessment is carried out in 3 stages by different specialists:
- By the operator in the production process, in order to promptly correct the causes of defective products;
- By the foreman - to check the work of the entire shift - how quickly the causes of the defects were eliminated, what % of the faulty products is on the pallet;
- By the manufacturing engineer / head of the quality control department - right before sending the products to the client.

That’s why when developing the QuatroPBC interface, the needs of each user were taken into account – so that the data solved the specific tasks of a specialist, because the shop manager does not need online statistics, but needs to view and analyze more comprehensive statistics - by shifts; while the head of the Quality Control Department analyzes top-level statistics - by weeks, months and years in order to submit a report to the plant management for subsequent management decisions.
The operator, on the other hand, needs a real-time report, the ability to view statistics for each product within 1 cycle.
Operative report
Report for recently produced items in real time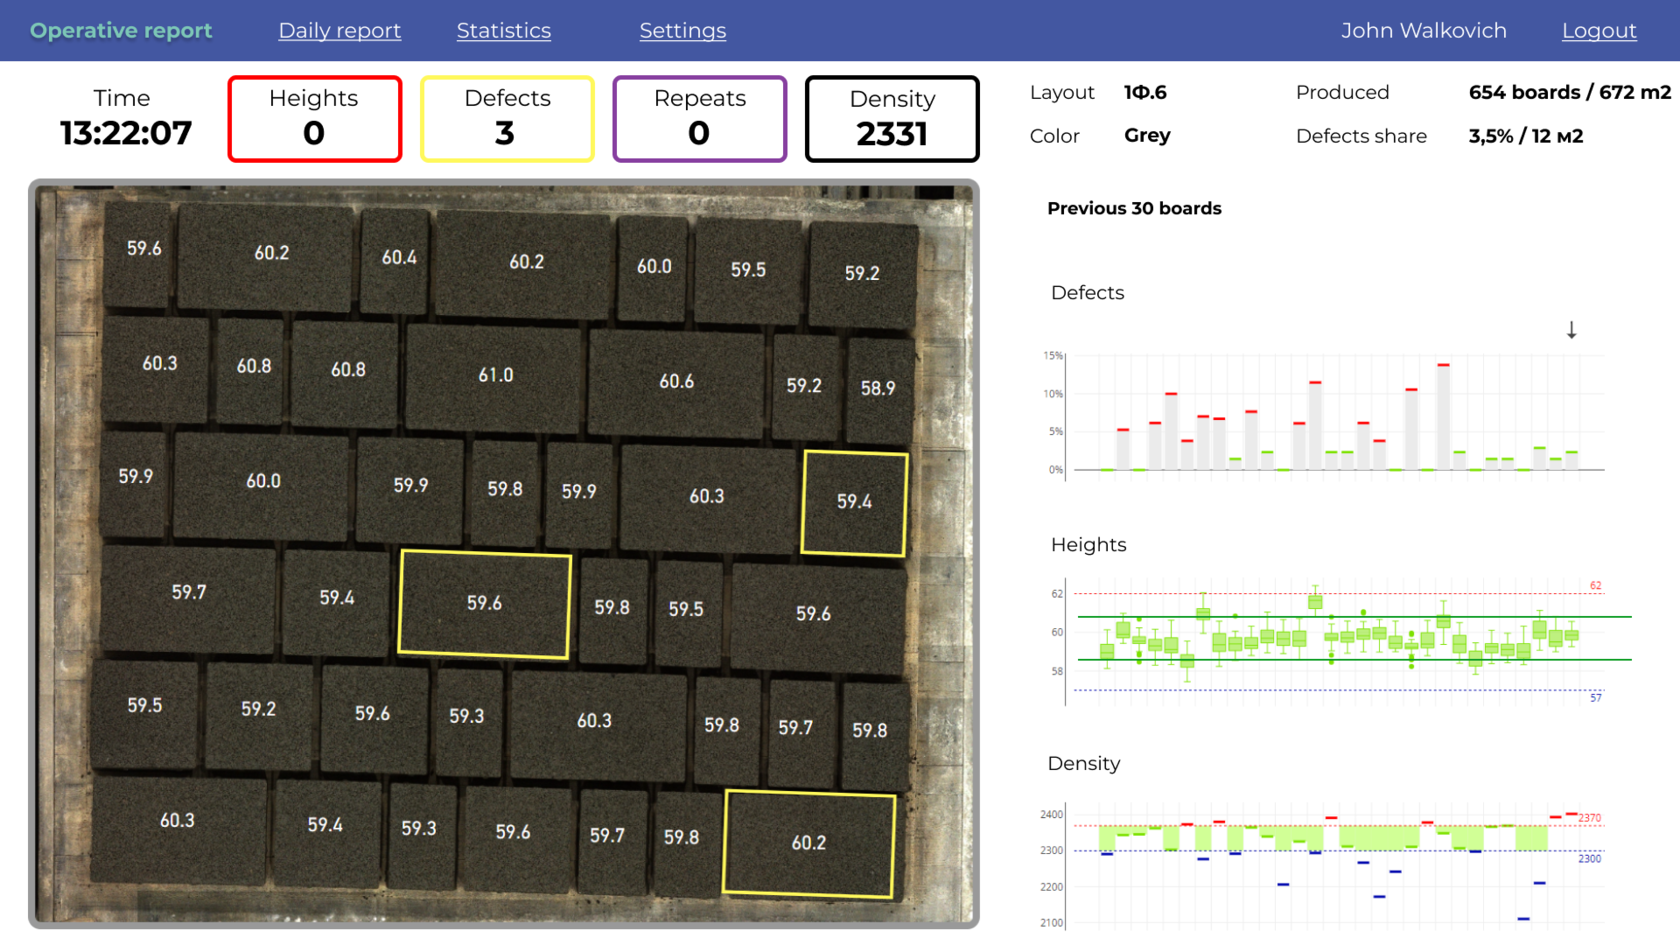
Indicators such as heights, density and percentage of defects are displayed on the graph.
Daily report
Report on all batches produced per day.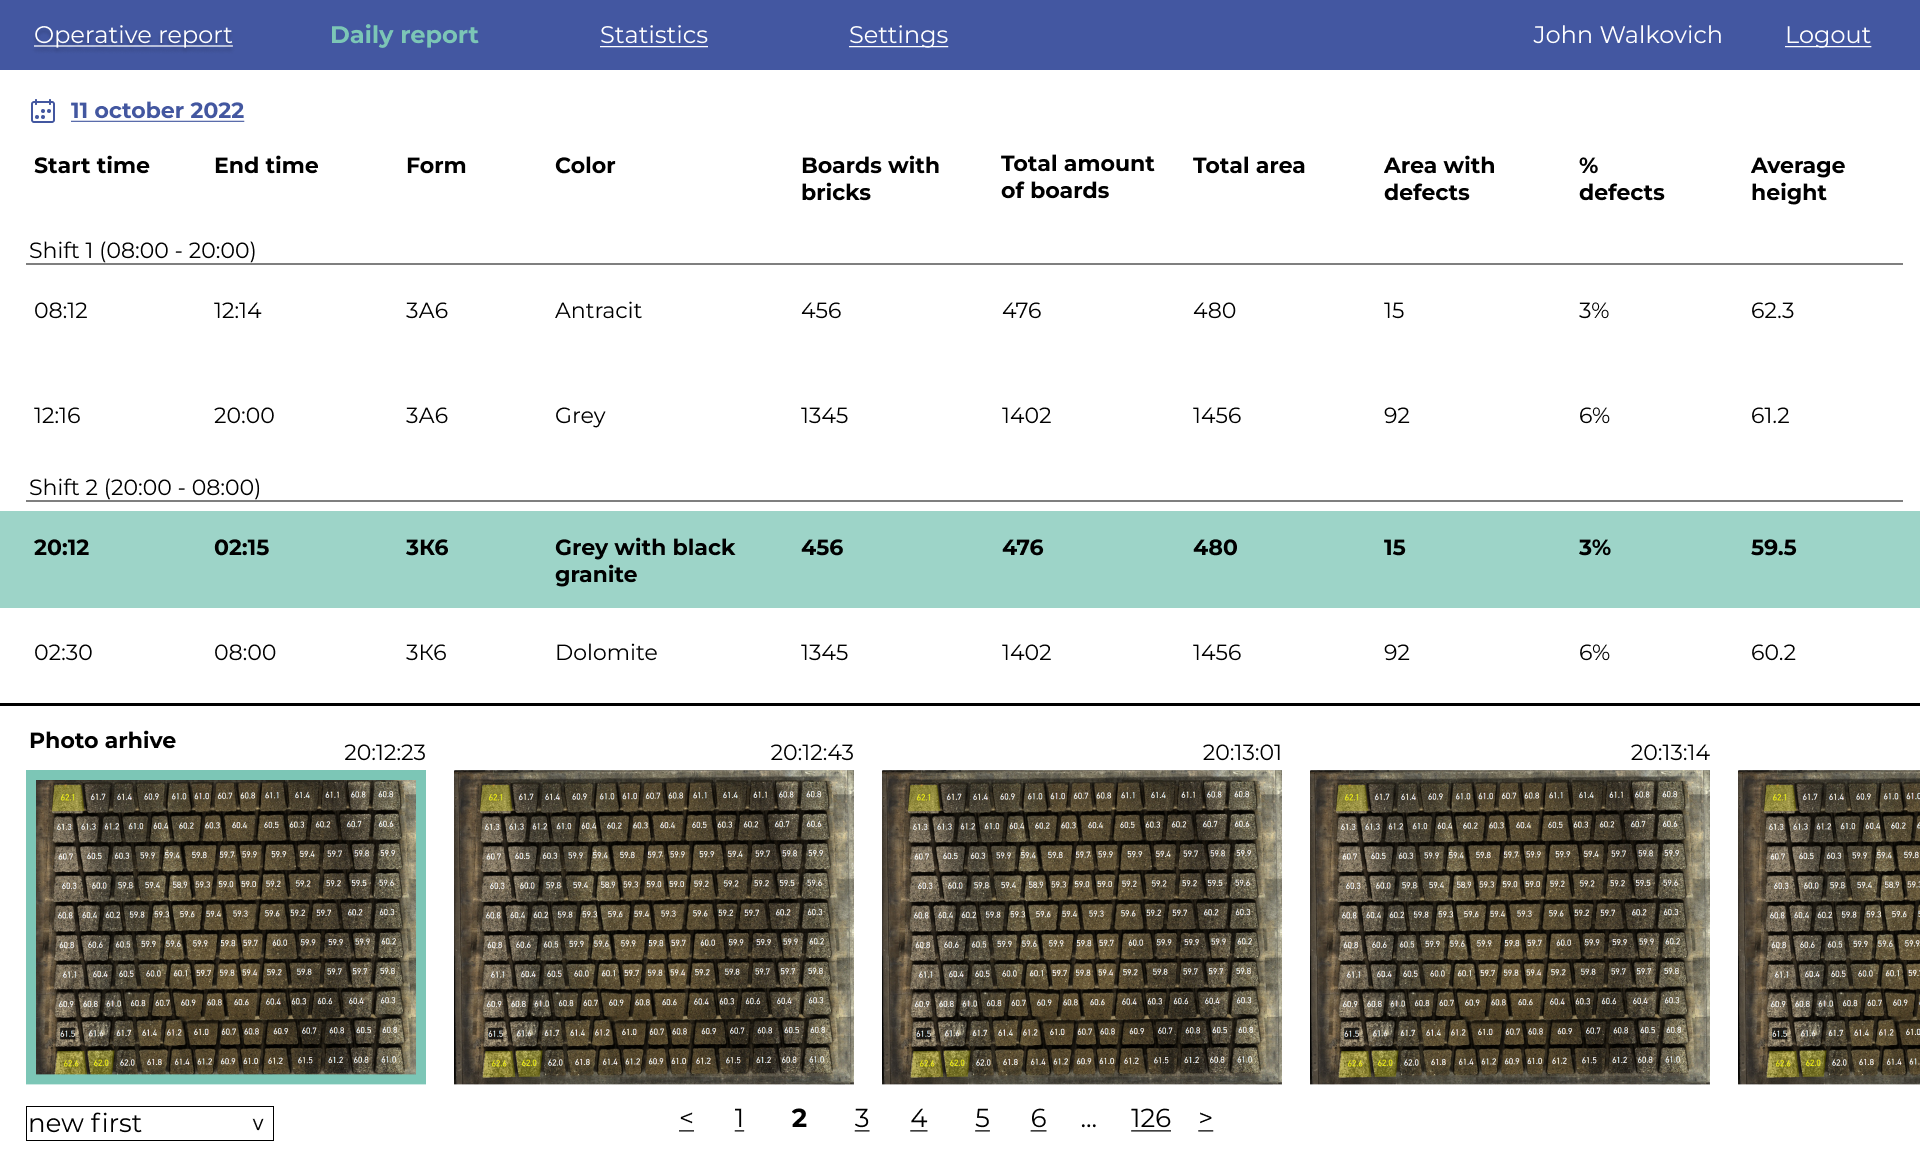
+ Date and time of the begging and end of production,
+ Shape, layout and color,
+ Number of production pallets and area of products,
+ Share of defects and area of defective items,
+ Photo archive for every batch – stored up to 90 days.
Statistics
Analysis of the efficiency of production in general
produced are aggregated into reports, including:
+ The total production by months and the total share of defective products,
+ Defects for operators, shape, color and texture,
+ Average heights by product groups,
+ Information about all produced batches.
Data analysis directly leads to the reduction of percentage of faulty produce in the manufacturing of paving slabs. Making it possible to draw conclusions and make decisions based on statistics of actual data from the production, and not on speculation and forecasts.
Fill out the form below to learn more about QuatroPBC and get a product presentation.


